Project information
- Category: Data Visualization
- Course: DV Concepts,Tools,Techniques,and Paradigms
- Project date: December 2022
- Project URL: Tableau-CSC805-DataVisualization
Project Details
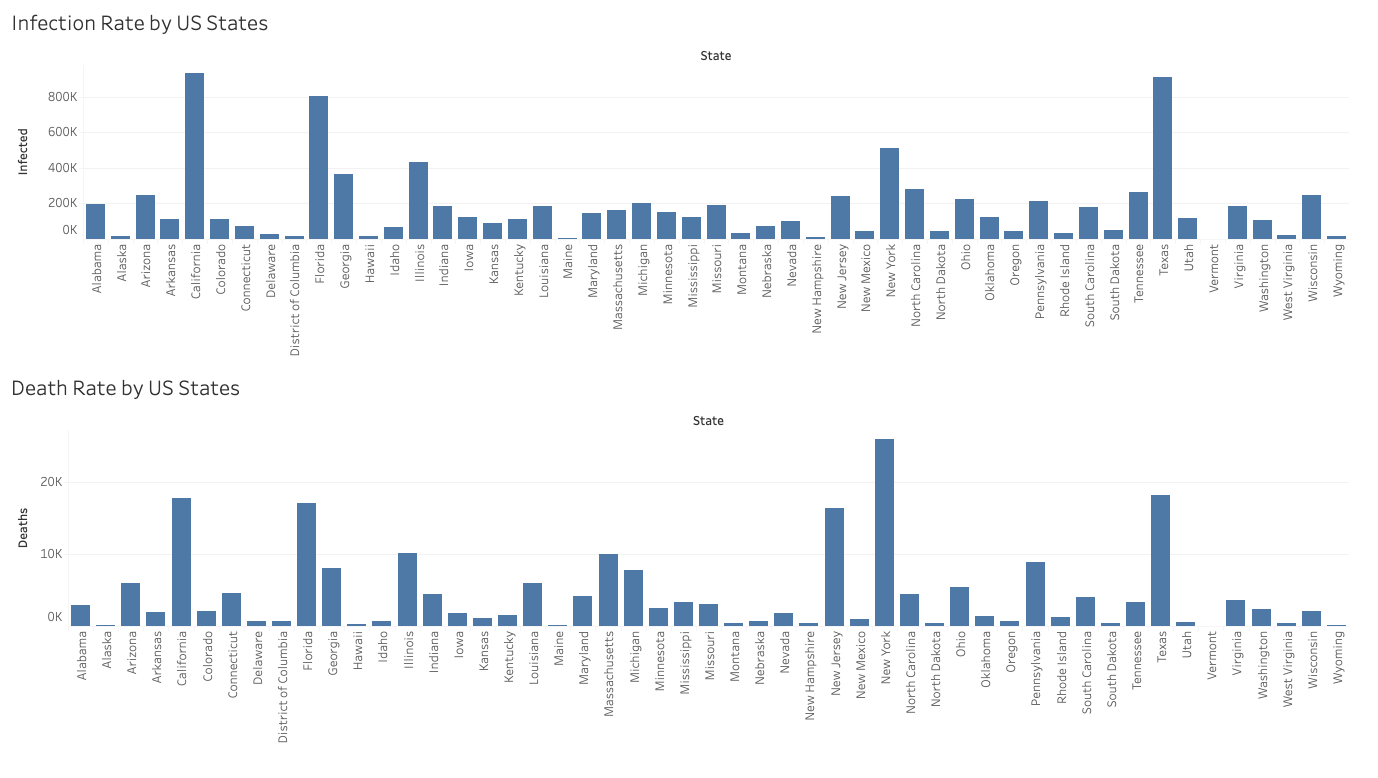
- Build a system using Tableau to easily visualize and compare the United States "state-wise" COVID-19 information.
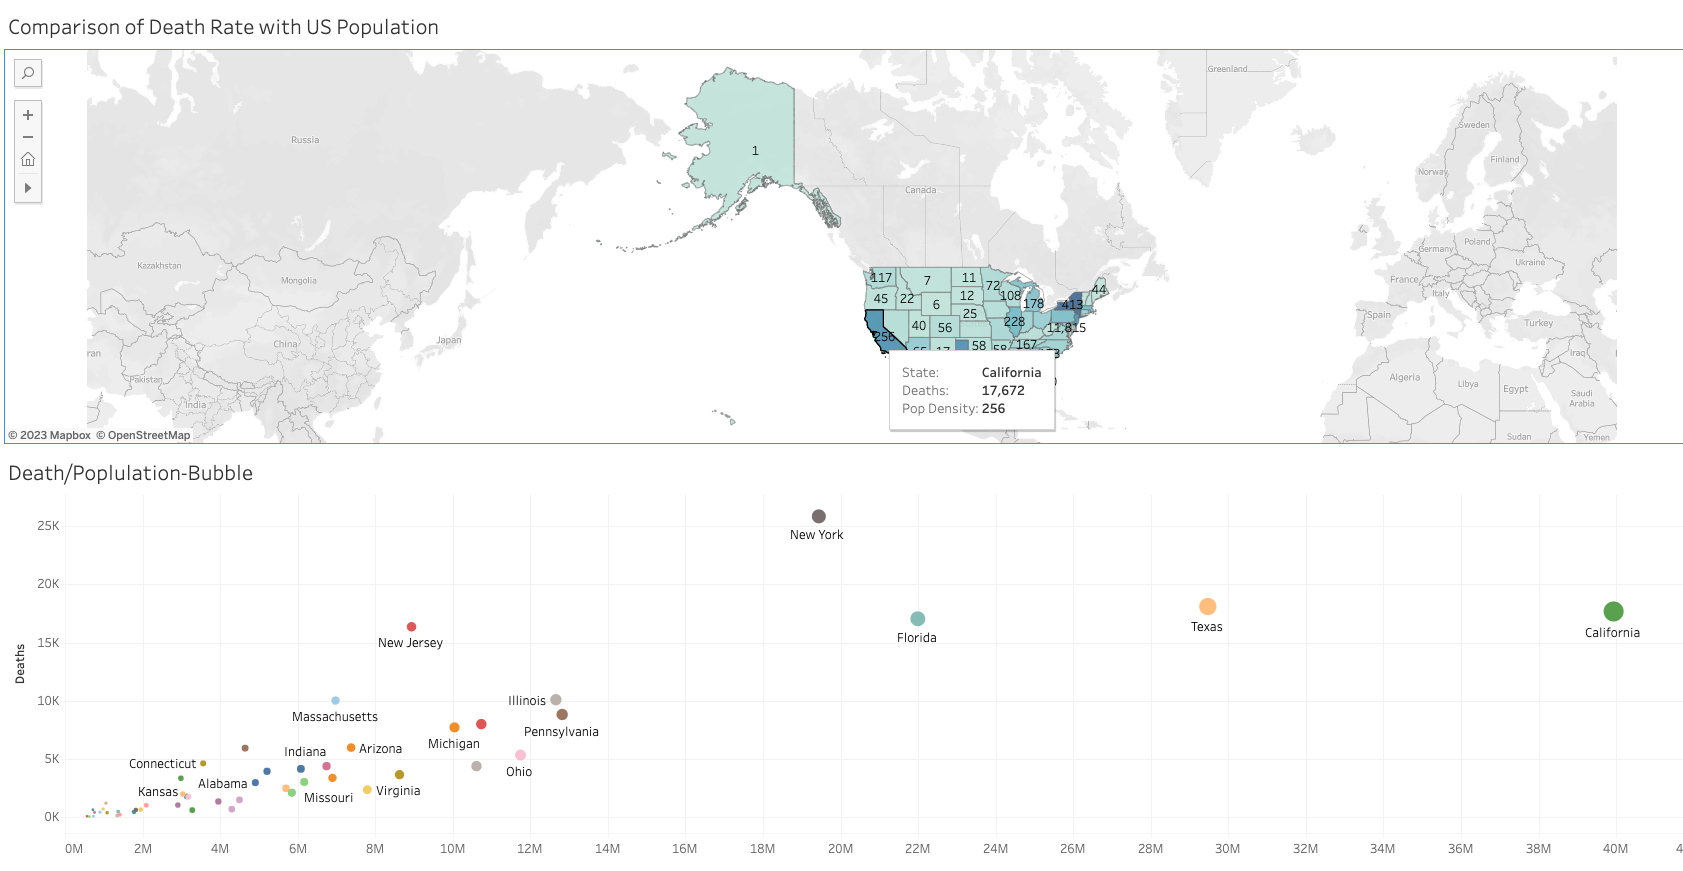
- Users shall compare the relationship between the number of COVID-19 deaths and the population density of the state.
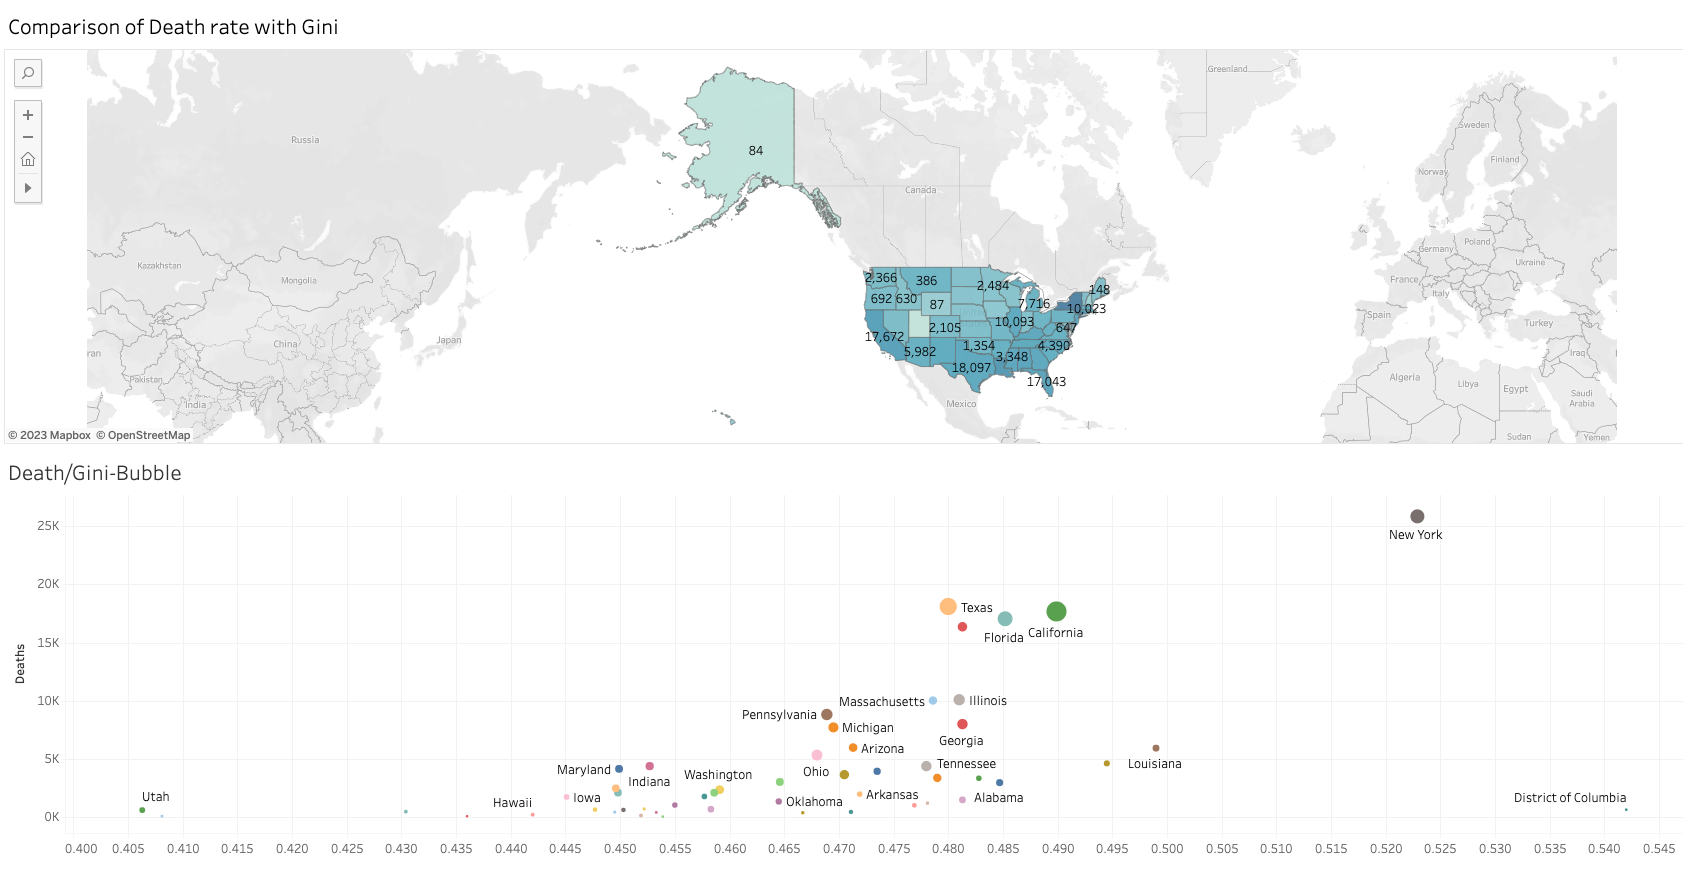
- Users shall compare the relationship between the number of COVID-19 deaths and the income per capita/Gini coefficient for income inequality in the state.